
Hone in on the details of your running form with help from Garmin.
Garmin’s collection of ‘Running Dynamics’ metrics may provide unparalleled insight into the finer details of your form, but using them effectively isn’t always straightforward.
Unless you educate yourself on what each feature actually means—and understand how monitoring it during your training can help you improve—the running-focused insights section of your Garmin watch can go unused.
Below, then, we’ve provided a quick round-up of what each feature is and what they might indicate.
Which watches offer native Garmin Running Dynamics?

Garmin continues to offer its Running Dynamics Pod and HRM chest straps for those who want to add these metrics to their current watch, and the list of devices compatible with these accessories is virtually endless.
However, there is also now a growing number of Garmin watches that don’t require an accessory, giving users Running Dynamics directly from the wrist. They can’t natively track ground contact balance (GCB) because, of course, that’s virtually impossible from one wrist.
Still, they can log ground contact time (GCT), cadence, stride length, vertical oscillation, and vertical ratio without an accessory.
Here’s the current selection as of May 2025:
- Enduro 2/3
- Epix (Gen 2) & Epix Pro (Gen 2) series
- Fenix 7 & Fenix 7 Pro series (and Quatix 7, Tactix 7, D2 Mach, Descent Mk3)
- Fenix 8 series (and others from the eighth-gen outdoor watch family)
- Fenix E
- Forerunner 255/265/570/945 LTE/955/965/970/
- Instinct 2/3 series
- MARQ (Gen 2) series

Garmin watches that ONLY offer wrist-based Running Dynamics
Curiously, some of Garmin’s more modern watches don’t allow for sensor pairing to gain additional insights. This is a reasonably new quirk within Garmin’s feature stacking. And while you do receive some metrics, it means there’s no ability to gain insights into GCTB or metrics introduced in 2025, such as Step Speed Loss (this is only available via the Forerunner 970/HRM 600).
- Forerunner 165
- Venu 3
- Vivoactive 6
Explained: Garmin Running Dynamics
In total, Running Dynamics consists of seven different metrics, although Garmin also includes its Running Power feature and Hill Score as part of the group. Below, we’ll outline what you can expect from each.
New for 2025: Step Speed Loss

At the time of writing, the availability of Step Speed Loss (SSL) is minimal; it’s only available on the Garmin Forerunner 970 when paired with the Garmin HRM-600.
However, in some early tests of the new metric, we’ve found it to be quite helpful in improving our understanding of our running economy. Initially, we weren’t clear on whether this would provide much beyond what GCT (below) shows, but there are solid use-cases for the insight.
Step Speed Loss measures the difference between your forward speed when your foot first hits the ground and your minimum forward speed. In cm/s, the HRM 600 essentially measures how much you put on the brakes with each step. As someone who can tend to overstride at slower paces during marathon training—and who has the lateral knee and hip injuries to prove it—this could prove invaluable in ensuring I keep a snappy, consistent glide and remain efficient.

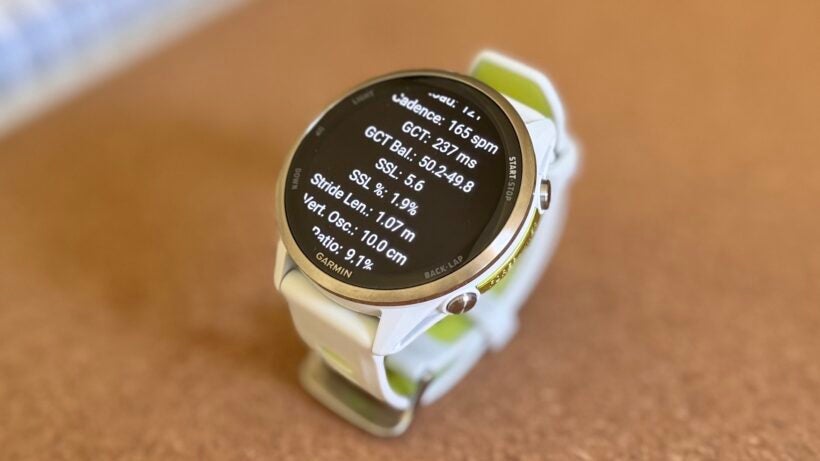
I’ve set up the Garmin data field above on the 970 to show my live SSL on a gauge, as well as my average for the session, and my last lap SSL (great for understanding if my SSL is declining as my legs tire, and a good reminder not to linger on each step).
Interestingly, Garmin also indicates that SSL is clever enough (via the 970’s barometer) to adjust your SSL based on the grade of your run. However, this doesn’t work on a treadmill, and Garmin also cautions the effectiveness of the metric on mega variable surfaces like technical trails (or when walking, since it’s programmed to gauge your performance against other runners).
Ground Contact Time (GCT)

Ground contact time (GCT) is the amount of time your foot spends on the ground with each step. Garmin averages this out at the end of a workout, but you’re also given a detailed graph in Connect of the points at which it varied. You can also set up data screens to view this in real-time.
In Garmin Connect (or on the GCT gauge data field option), this will show different colors depending on how your GCT relates to different percentiles of fellow runners, which you can view by pressing ‘Help’ next to the graph.
Elite runners tend to have contact times closer to 200ms than 300ms, though it’s important to keep in mind that this metric does vary quite a lot when you factor in different paces, stride lengths, and stride techniques.
Ground Contact Time Balance

A really handy insight for those who want to ensure effort is evenly spread between each leg, ground contact time balance (GCTB) monitors the symmetry of your steps.
For obvious reasons, it’s not available without an external Garmin sensor, but once you have one hooked up, you’re able to add a real-time gauge to your watch and assess this balance.
We find this particularly helpful for managing our balance during hills, intervals and when managing niggling injuries, when our GCTB often tends to go awry.
Cadence

A metric plenty more users will be familiar with, cadence is the measure of how many steps are taken per minute.
A cadence of 180 steps per minute is often cited as the standard for runners, though this may vary if you’re taller than average or if you’re running at a pace lower or higher than a typical 6/10 or 7/10 effort.
Like with other Running Dynamics metrics, Garmin will assess your average cadence and maximum cadence from a session and color-code the graph based on how it compares to other runners.
With these colors not really taking into account your own personal pace or effort, however, make sure to take this cross-examination with a pinch of salt; we tend to only really pay attention to our cadence on race-ish pace runs when we’re trying to maximize efficiency.
Stride Length

Another key insight into your running form, stride length is precisely what you would expect—the distance covered with each left and right step.
This figure is averaged at the end of a session, similar to other metrics. However, if you’re an overstrider like us, adding a data field to your watch can be really helpful in managing this during runs.
Among all the insights in the Running Dynamics family, stride length is likely the most personal. It is significantly influenced by your height, weight, strength, and flexibility, and typically does not vary much within your own range.
Vertical Oscillation

Vertical oscillation refers to the amount of bounce you have in each step, measured in centimeters.
Garmin notes that more experienced runners usually have lower vertical oscillation, although this figure is also significantly influenced by pace.
A faster pace often correlates with lower vertical oscillation, which is where the Running Dynamics metric Vertical Ratio (below) can help provide additional context.
Vertical Ratio

This is a superb way of getting an idea of how efficient your form is, with it essentially measuring how well you propel yourself forward with each stride.
Vertical ratio is the sum of your vertical oscillation divided by your stride length, delivered as a percentage. A lower vertical ratio percentage indicates a lower effort and a more efficient form.


